http://www.algebralab.org/img/0fb26b54-cfb7-4504-83b8-c0af24d117a0.gif
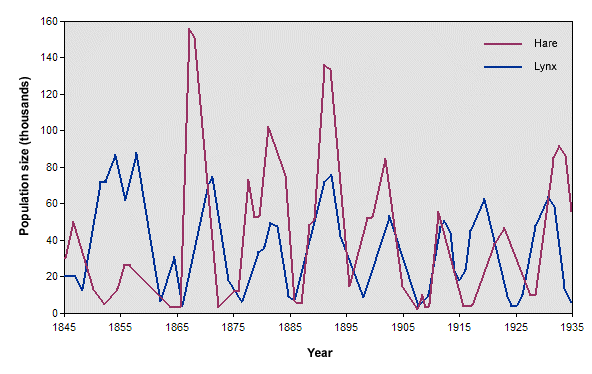
This Predator/Prey graph demonstrates the relationship between the hares (prey) and the lynxes (predator). This graph also shows the relationship between Horned Vipers (predator) and Jerboas (prey). On the graph, you can see the prey population drop when the predator population increases. When there isn't enough prey, the predator or Horned Viper population decreases because they die or try to find food somewhere else. When the Viper population decreases, the jerboas get a chance to re-populate and keep breeding until the number of vipers exceeds the speed that the jerboas can breed or the desert cannot support the amount of jerboas in the region. Then the population drops and then the scenario repeats itself again.
Resources
"Biology Graphs: Predator and Prey." Biology Graphs: Predator and Prey. Web. 17 May 2016.
